
Analyzing Google Serp Composition
Introduction
Google continues to shift Search Engine Results Page (SERP) content away from traditional blue links and toward dynamic features like AI Overviews, Perspectives, and Forums.
Quantifying these changes is essential to understanding how search visibility evolves and which types of content Google prioritizes.
To do this, we analyzed Q1 2025 SERP data across several dimensions, including business keyword type (Reputational vs. Growth), keyword intent (informational vs. transactional), brandedness, and the presence of AI Overviews (AIOs).
For more information regarding the definition of the keyword segments, see Keyword Segment Definitions.
Our findings reveal notable shifts in SERP composition, summarized below:
Executive Summary
Reputational (Rep) keywords strongly correlate with media-rich features (Top Stories, Twitter Embeds, Profile Panels), emphasizing authoritative content.
Growth keywords frequently surface community-driven content (especially Reddit), reflecting exploratory search behavior.
Transactional keywords significantly drive SERP enhancements (FAQs, Perspectives, Forums), with a strong emphasis on consumer-driven discussions.
AI Overviews (AIOs) universally boost Related Questions. For Rep queries, they suppress Top Stories while slightly enhancing Perspectives. For Growth queries, AIOs notably elevate community content such as Reddit and Quora.
Branded keywords prominently trigger Perspectives and Reddit results, particularly when the query has transactional intent—suggesting Google favors diverse viewpoints for emerging brands.
Data Collection & Structure
Three data sources power this analysis:
KEYWORD_SERP_FEATURES: One row per keyword-week with Boolean flags for SERP features (e.g. Top Stories, Perspectives) plus metadata like keyword type, intent, brandedness, and AIO presence.SERP_OVERVIEW: Raw JSON for each AI Overview, including citations and generated content.ORGANIC_RESULTS: Top 10 organic links per keyword-week, exploded into individual rows.
Date window: Q1-2025
Sampling & bootstrapping strategy
The raw dataset was heavily imbalanced: Rep keywords were scarce in three out of four keyword segments defined by Growth metrics, while Growth keywords were plentiful across all segments. To enable fair weekly comparisons we:
- Down-sampled Growth to match the largest Rep slice we could keep intact.
- Bootstrapped Rep bins with < 100 rows up to 100 (with replacement) so each slice had comparable variability.
- Left the Informational , Non-Branded Rep slice untouched (910 rows) and matched Growth to that size.
| Bin | Raw Rep | Growth after down-sample | Rep after bootstrap | Strategy |
|---|---|---|---|---|
| Informational , Branded | 14 | 100 | 100 | Bootstrap Rep to 100 |
| Informational , Non-Branded | 910 | 910 | 910 (N/A) | Keep Rep full; down-sample Growth to 910 |
| Transactional , Branded | 10 | 100 | 100 | Bootstrap Rep to 100 (note: very small original size) |
| Transactional , Non-Branded | 28 | 100 | 100 | Bootstrap Rep to 100 |
Statistical analysis methodology
To quantify how SERP feature behavior differs across keyword segments, we used the Cochran–Mantel–Haenszel (CMH) test — a statistical method ideal for comparing outcomes across stratified data (in this case, week-by-week slices).
For each week, we built a 2 × 2 contingency table comparing:
- Rows: Feature presence (
yesvs.no) - Columns: Keyword type (
Repvs.Growth)
Example structure:
| Feature Present | Feature Absent | |
|---|---|---|
| Rep | a | b |
| Growth | c | d |
This was repeated weekly for every SERP feature.
The CMH test then aggregates those weekly comparisons into a single, pooled test statistic — similar to a meta-analysis — while controlling for week-level variation. This approach ensures our findings aren’t driven by outliers from specific weeks and provides a stable estimate of the overall directional effect.
We report the following for each test:
- Odds Ratio (OR): Likelihood of a feature appearing in one group vs. another
- CMH χ² Statistic and FDR-adjusted p-values: Significance after correcting for multiple comparisons
Why CMH?
Unlike a basic pooled test, CMH preserves temporal structure, which is crucial for understanding shifts in SERP behavior over time.
Results
Part 1: Serp features
The following sections compare different keyword categories, highlighting how SERP features vary by keyword type and which domains appear most frequently within each group.
1.1: Rep vs. Growth
Rep queries tended to trigger news and authoritative content, while Growth queries leaned toward community forums and exploratory modules.
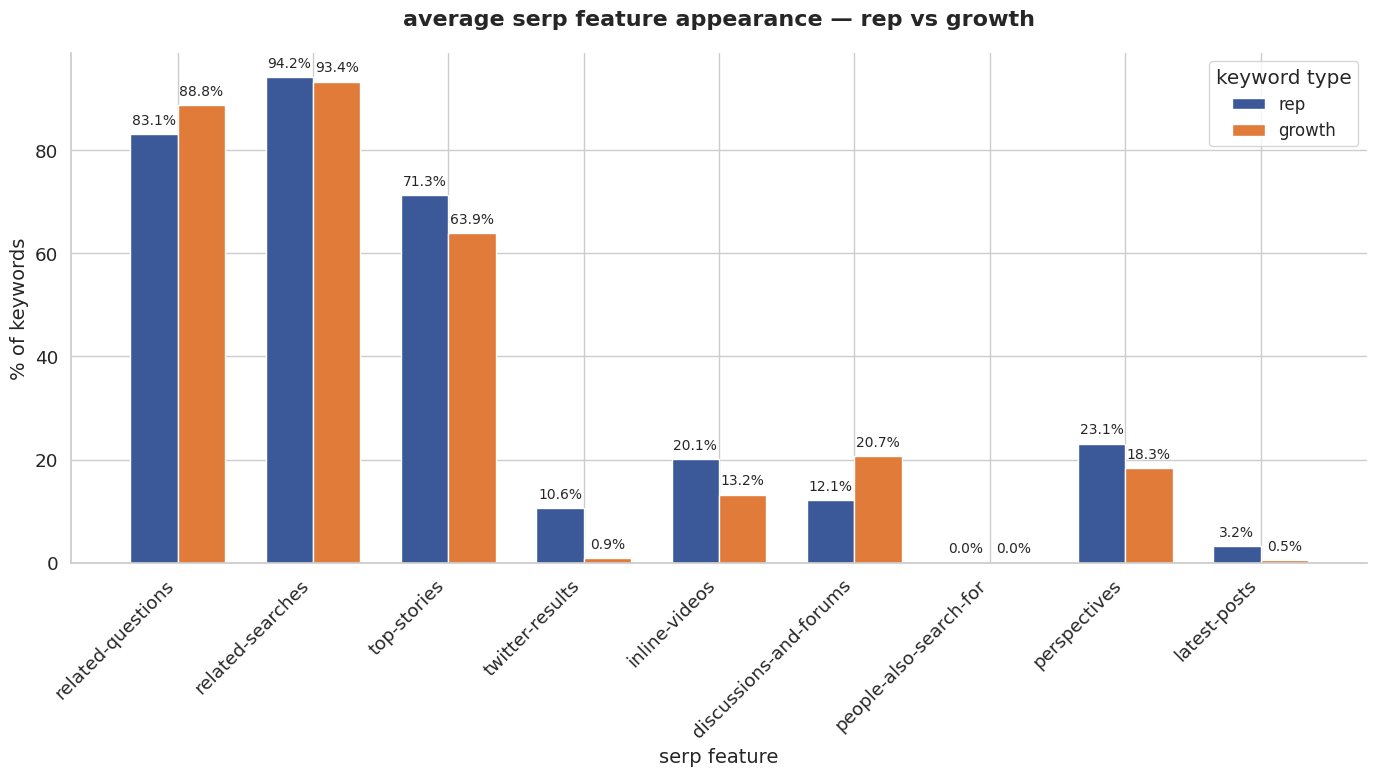
Statistical analysis
| Feature | Gap | Phi (φ) | Adj. p-value | Verdict |
|---|---|---|---|---|
| Twitter embeds | +8.27 | 0.174 | < 1e-10 | Rep-heavy |
| Inline videos | +7.37 | 0.099 | < 1e-10 | Rep-lean |
| Top Stories | +7.70 | 0.082 | < 1e-10 | Rep-lean |
| Latest-Posts carousel | +2.61 | 0.098 | < 1e-10 | Rep-lean |
| Perspectives | +2.13 | 0.026 | 9e-6 | None |
| Related Questions | -7.63 | -0.113 | < 1e-10 | Growth-heavy |
| Discussions & Forums | -7.77 | -0.109 | < 1e-10 | Growth-heavy |
| Related Searches | -0.43 | -0.009 | 0.11** | None |
*Gap = Rep − Growth, in percentage points
**p > 0.05 means not statistically significant
Verdict scale: |φ| ≥ 0.10 = heavy , 0.05–0.09 = lean , < 0.05 = none
Takeaways:
Media-heavy modules (Twitter, Videos, Top Stories) favor established Rep queries, while discovery modules (People-Also-Ask, Forums) live on Growth queries — exactly the behavior we suspected but never quantified until now.
1.2: Keyword type × Brandedness
This section compares SERP features for branded versus non-branded queries, showing how Google treats each differently.
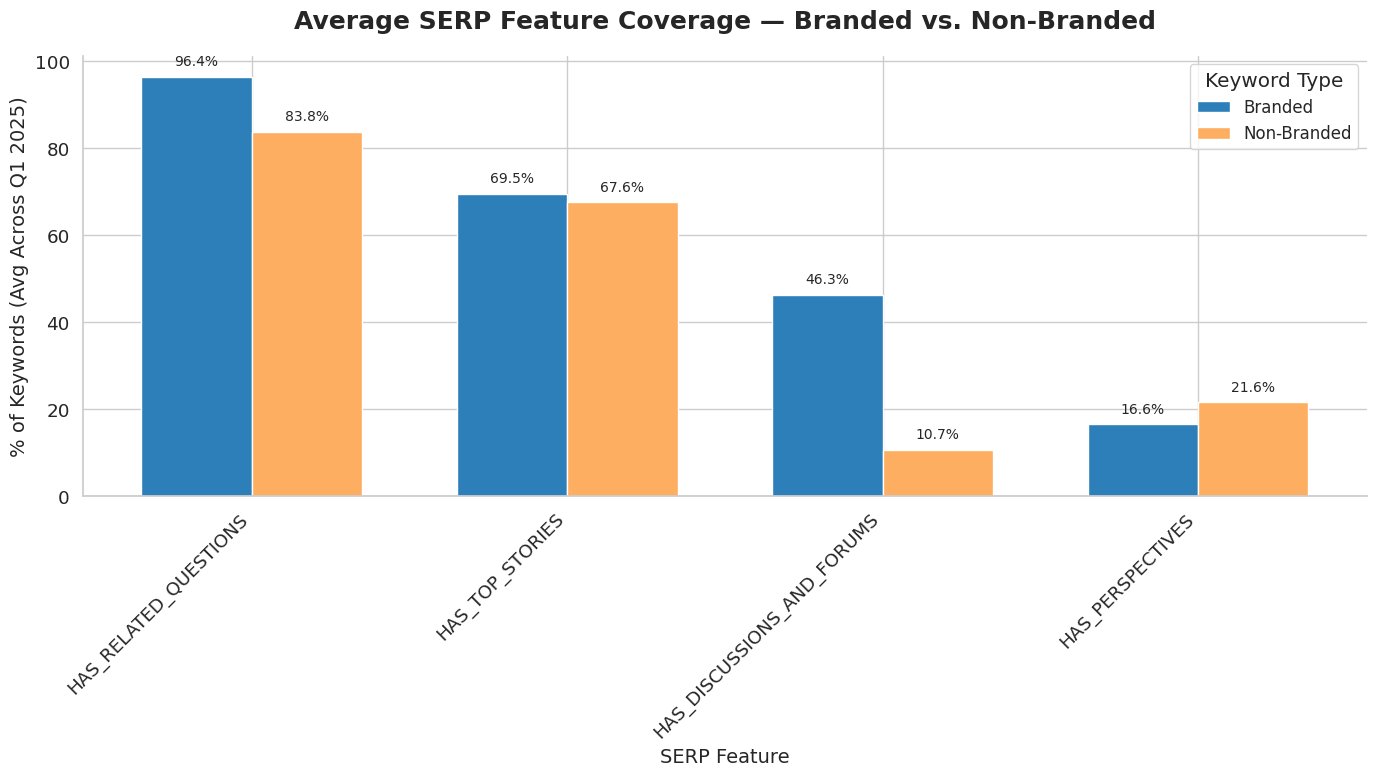
Statistical Significance & Effect Size
| Comparison | Feature | Gap (%) | φ | Verdict |
|---|---|---|---|---|
| Branded | Top Stories | +12.5 | 0.13 | Rep-heavy |
| Perspectives | −20.5 | 0.27 | Growth-heavy | |
| Forums & Discussions | +12.0 | 0.12 | Rep-heavy | |
| Related Questions | −1.9 | 0.05 | Small (none) | |
| Non-Branded | Related Questions | −8.5 | 0.12 | Growth-heavy |
| Top Stories | +6.9 | 0.07 | Rep-lean | |
| Perspectives | +6.0 | 0.07 | Rep-lean | |
| Forums & Discussions | −10.8 | 0.18 | Growth-heavy |
Verdict scale: |φ| ≥ 0.10 = heavy , 0.05–0.09 = lean , < 0.05 = none
Takeaways
- Branded queries often trigger Related Questions and Forums.
- Rep-branded searches show more News and Forum content.
- Perspectives appear most with Growth-branded keywords.
1.3: Keyword type × Intent
Breaking down queries by intent shows that transactional searches — especially Rep queries — trigger more enhanced SERP features. Here’s how four key modules vary across intent and keyword type.
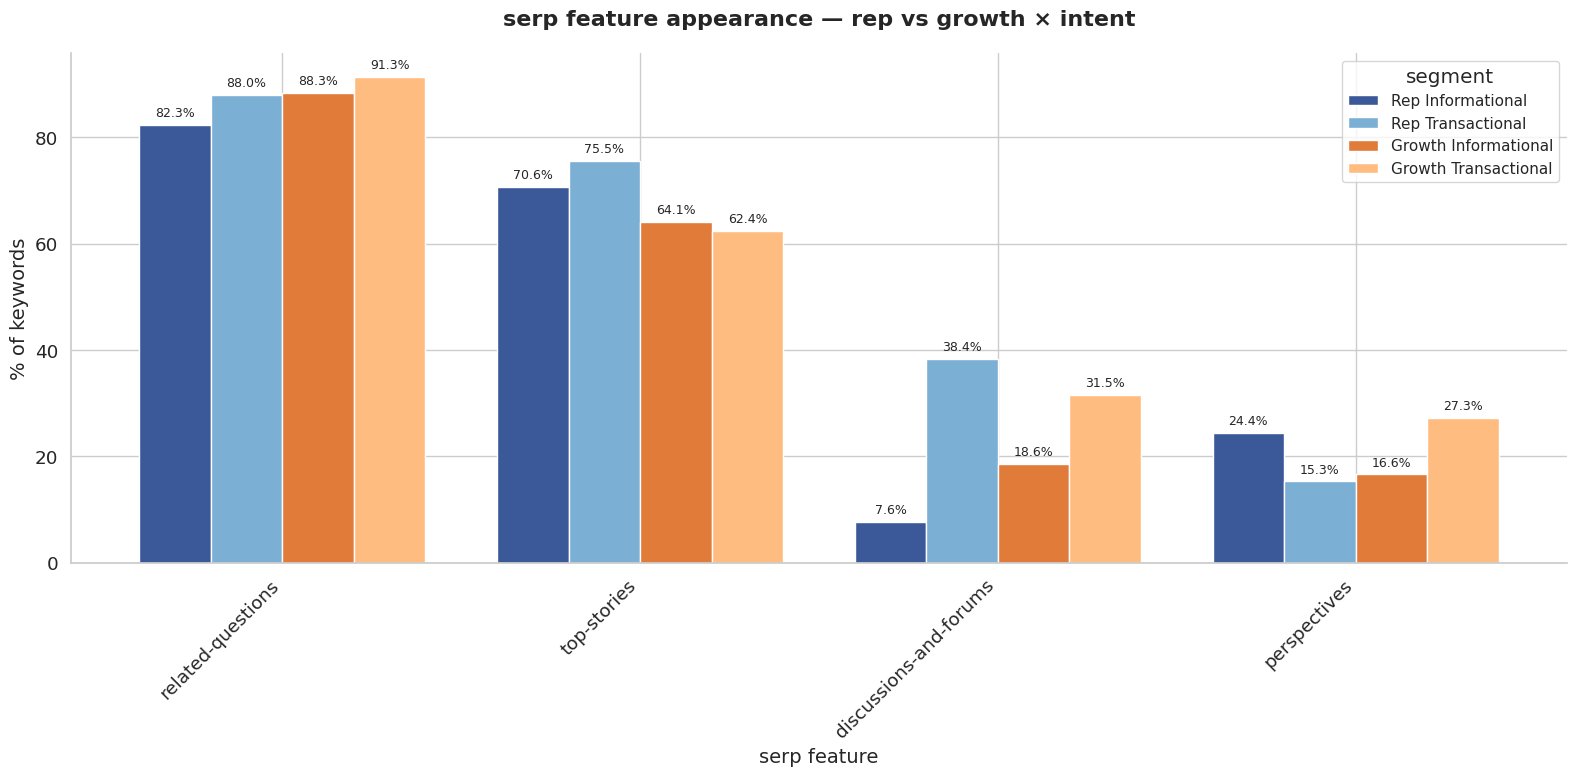
Statistical Inference – Informational vs. Transactional
| Intent | Feature | Rep % | Growth % | Gap (pts) | φ | Verdict† |
|---|---|---|---|---|---|---|
| Informational | Top Stories | 70.7 | 63.9 | +6.8 | 0.07 | Rep-lean |
| Perspectives | 22.4 | 16.7 | +5.6 | 0.07 | Rep-lean | |
| Related Questions | 82.3 | 90.5 | –8.2 | –0.12 | Growth-heavy | |
| Discussions & Forums | 7.1 | 17.0 | –9.8 | –0.15 | Growth-heavy | |
| Transactional | Top Stories | 76.0 | 62.9 | +13.0 | 0.14 | Rep-heavy |
| Discussions & Forums | 35.1 | 28.9 | +6.3 | 0.07 | Rep-lean | |
| Related Questions | 90.6 | 94.1 | –3.5 | –0.07 | Growth-lean | |
| Perspectives | 14.3 | 30.9 | –16.6 | –0.20 | Growth-heavy |
Verdict scale: |φ| ≥ 0.10 = heavy , 0.05–0.09 = lean , < 0.05 = none
**Takeaways **
- Transactional queries trigger People-Also-Ask more often, especially for Rep.
- News panels (Top Stories) are most frequent on Rep transactional searches.
- Growth transactional queries receive the most Perspectives panels.
- Forum links spike for Rep transactional queries and remain high for Growth transactional queries.
1.4: Keyword type × AI Overview (AIO)
We then analyzed how AIO affects SERP features for Rep vs. Growth keywords, comparing feature rates with and without an AIO present.
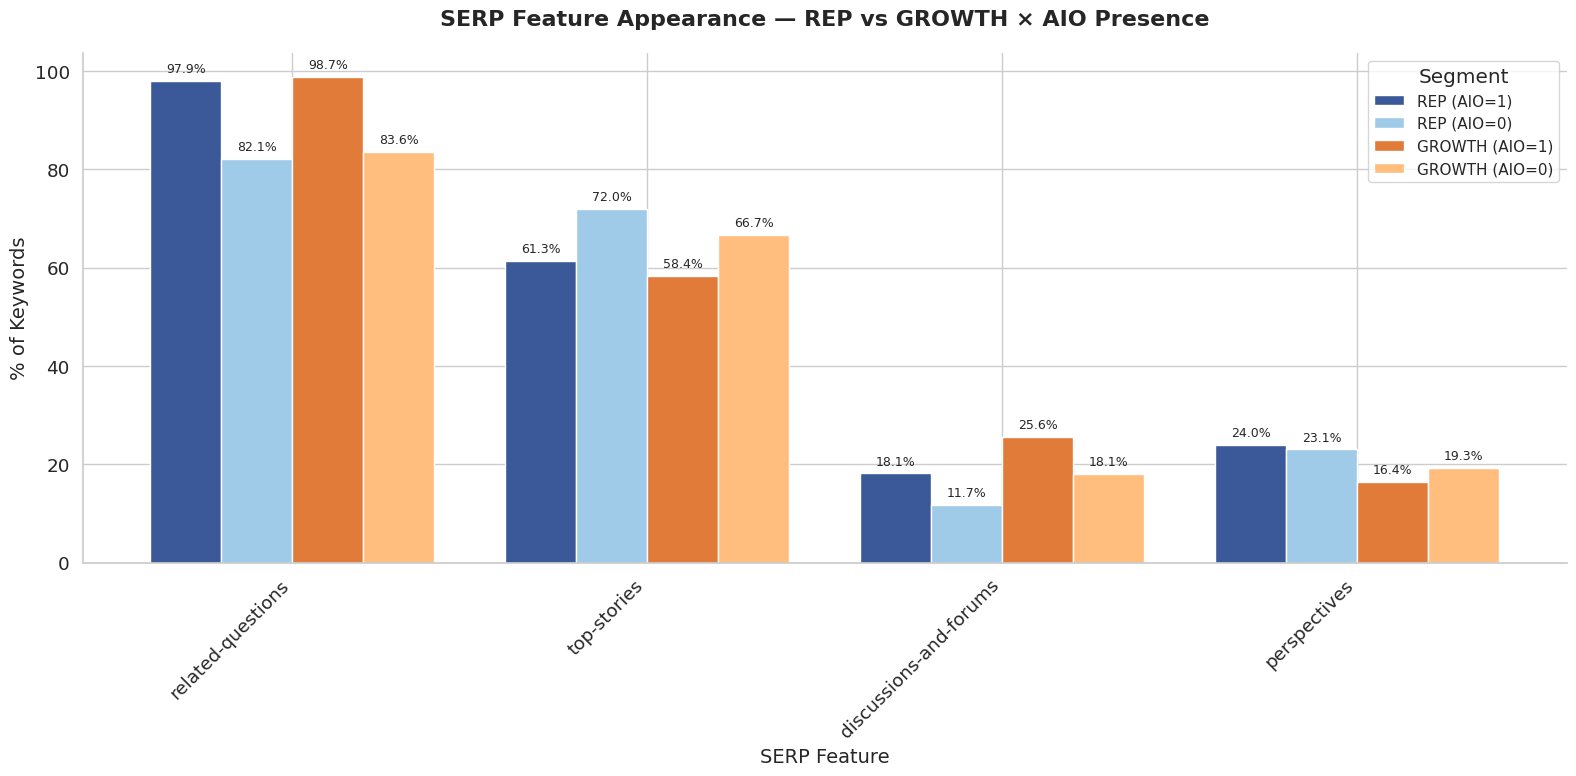
Statistical Summary
| AIO | Feature | Rep % | Growth % | Gap (pts) | φ | Verdict |
|---|---|---|---|---|---|---|
| 0 | Top Stories | 72.2 % | 67.5 % | +4.7 | 0.05 | Rep-lean |
| Related Questions | 82.5 % | 86.6 % | −4.1 | −0.05 | Growth-lean | |
| Discussions & Forums | 10.8 % | 16.2 % | −5.5 | −0.08 | Growth-lean | |
| Perspectives | 21.2 % | 20.4 % | +0.8 | 0.01 | None | |
| 1 | Top Stories | 61.0 % | 57.0 % | +4.0 | 0.03 | None |
| Perspectives | 21.3 % | 16.7 % | +4.6 | 0.05 | Rep-lean | |
| Related Questions | 97.9 % | 99.3 % | −1.4 | −0.05 | Growth-lean | |
| Discussions & Forums | 16.6 % | 23.7 % | −7.1 | −0.06 | Growth-lean |
Verdict scale: |φ| ≥ 0.10 = heavy , 0.05–0.09 = lean , < 0.05 = none
Takeaways
- Related Questions spike when an AIO is present, for both keyword types.
- News panels drop in AIO results — especially for Rep queries.
- Perspectives hold steady, with a slight Rep edge when AIO is present.
- Community results tilt further toward Growth when AIO is present.
Part 2: Target domain analysis
Which domains does Google trust most across different kinds of searches?
In this deep dive, we analyze the domains that appear most frequently in Google’s top 10 results — and how those patterns shift based on keyword type (Rep vs. Growth), brandedness, and user intent. We also examine how Google’s AI Overviews align (or don’t) with the organic rankings.
2.1: Target domain buckets — Rep vs. Growth
2.1.1: Organic domain buckets: Rep vs. Growth
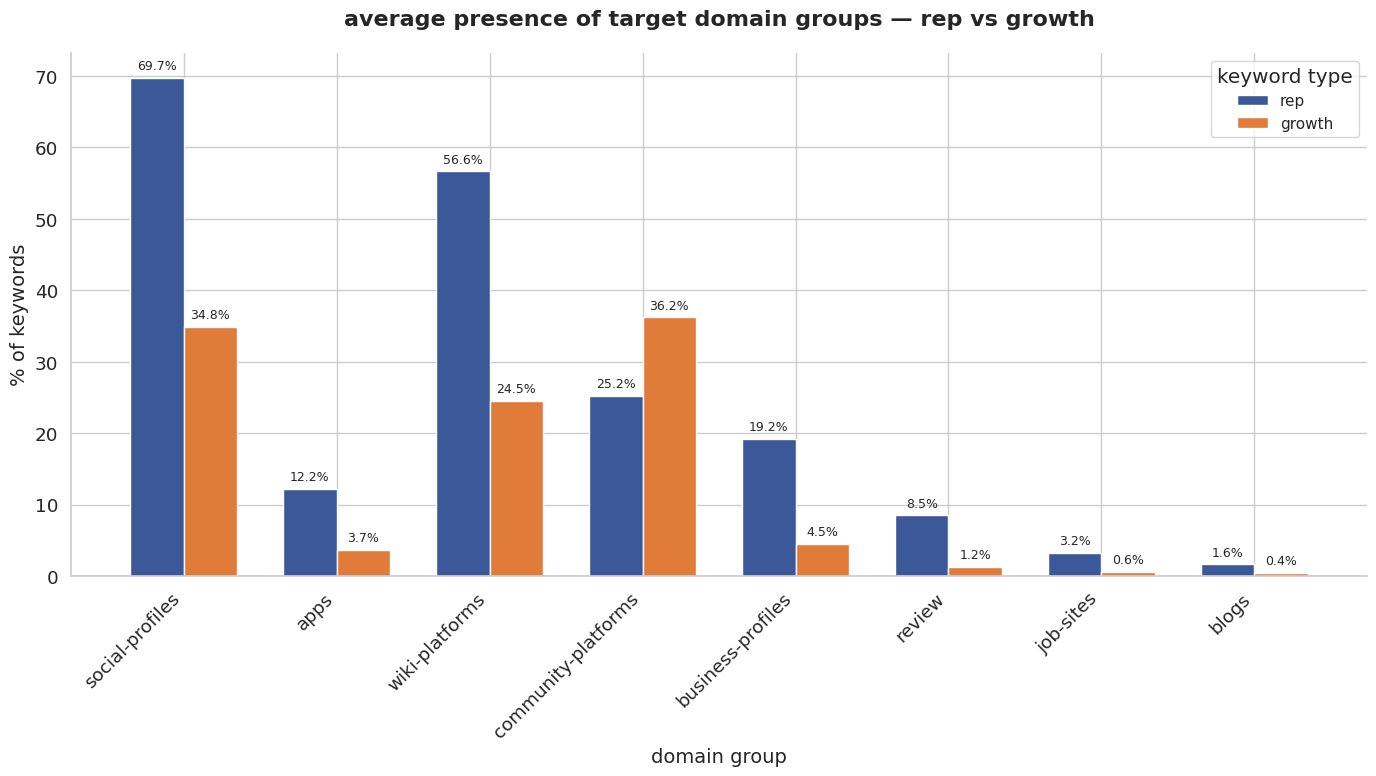
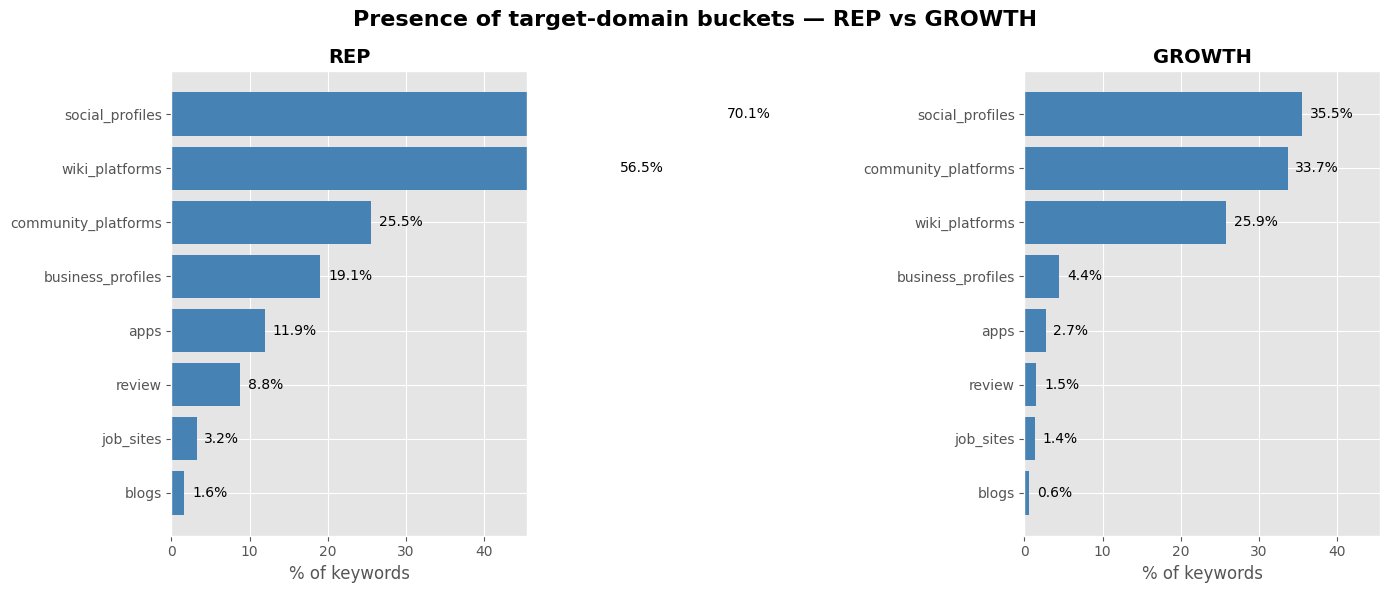
We measured how often domains from specific buckets appeared in the top 10 organic results.
Takeaways:
- Rep keywords surface social profiles (70%), Wikipedia (56%), and business profiles (19%) far more often than Growth keywords.
- Growth queries lead in community platforms like Reddit, Quora, and IMDb (~35%).
- App stores and review sites show a slight Rep edge.
- Job sites and blogs play a minor role in both categories (<5%).
2.1.2: AIO citations vs. Organic rankings
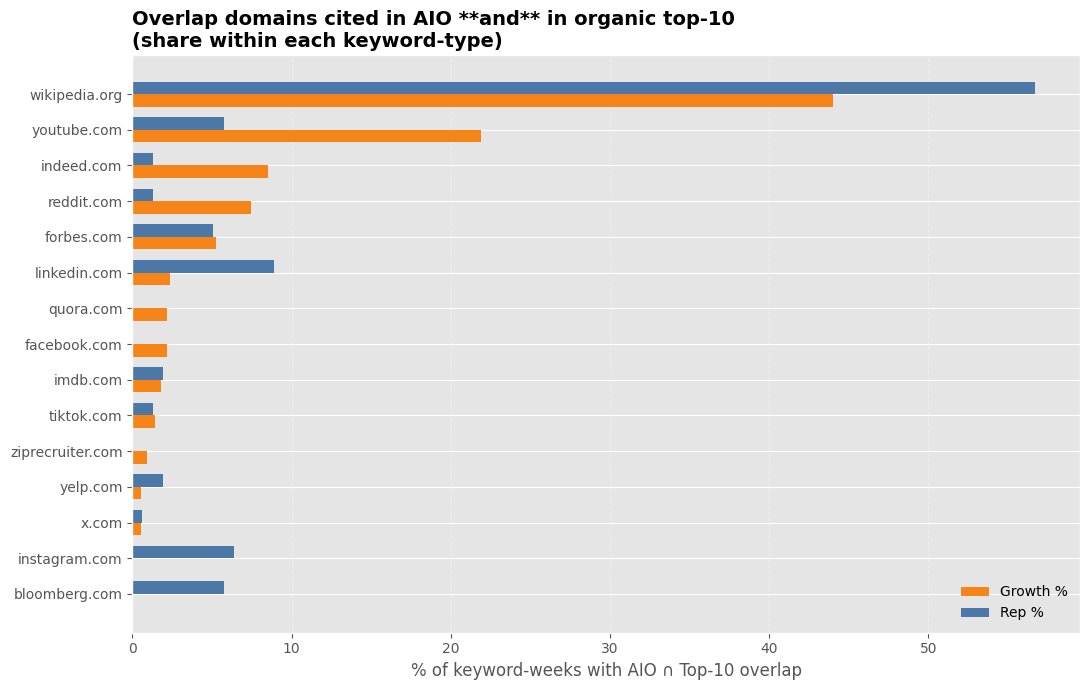
We then analyzed how often AIO citations matched domains already ranking in the top 10.
| Match Type | Count | % of Keyword-Weeks |
|---|---|---|
| Organic-only | 22,768 | 71.5% |
| Both (cited + ranked) | 883 | 2.8% |
| AIO-only | 677 | 2.1% |
| Neither | 7,532 | 23.6% |
Overlap is rare (only ~3% of queries).
Top overlapping domains:
| Domain | Growth Share | Rep Share | Notes |
|---|---|---|---|
| reddit.com | 41% | 34% | Growth dominant |
| twitter.com | 17% | 26% | Rep news-driven |
| wikipedia.org | 8% | 12% | Rep-heavy entity |
| linkedin.com | 9% | 10% | Balanced presence |
| youtube.com | 16% | 14% | Growth-leaning media |
Social and community platforms drive the overlap in both organic and AIO citations, but Rep and Growth favor different players.
2.2: Community platforms — Brandedness & Intent
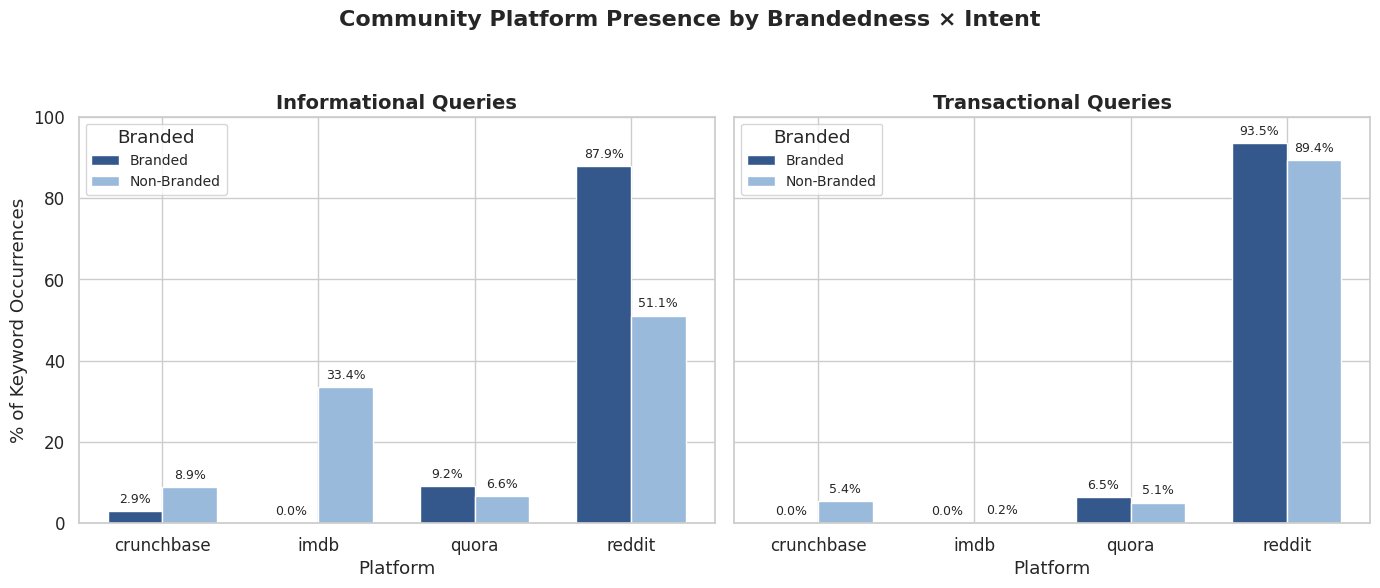
Google surfaces forum content either through the Discussions & Forums panel or as organic Reddit links in the top 10. We analyzed how often each format appears — and where they overlap — across query types.
Takeaways
- Community results for branded queries are almost exclusively Reddit.
- Non-branded queries show a diverse mix — IMDb leads the pack.
- Informational searches split between IMDb and Reddit
- Transactional searches rely almost entirely on Reddit.
2.3: Reddit vs. Discussions & Forums panel
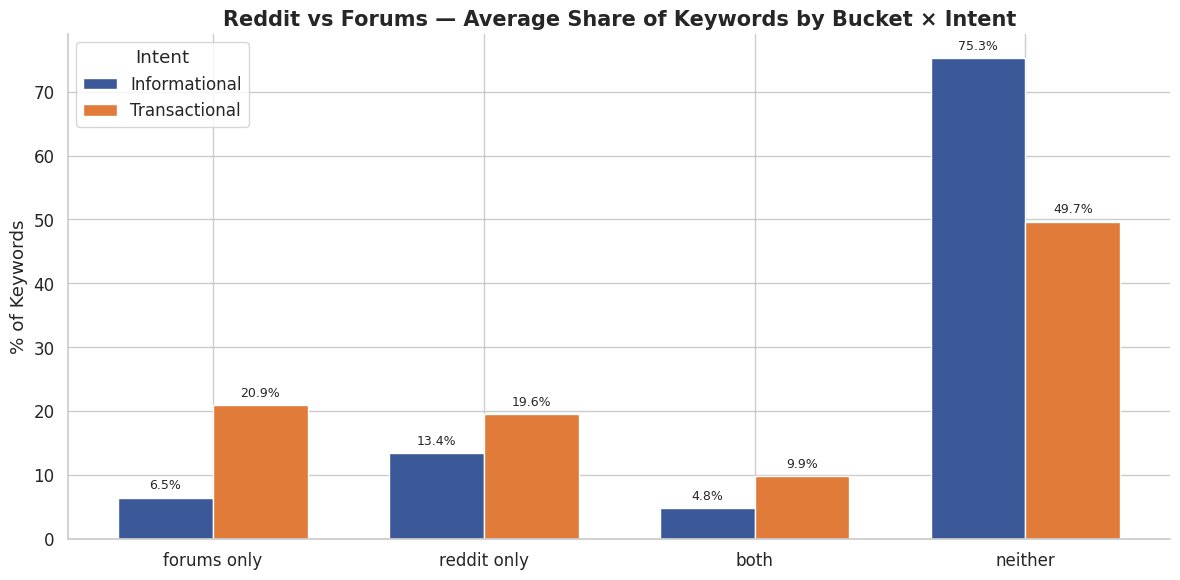
Google surfaces forum content in two main ways: the Discussions & Forums panel (a carousel of links) and organic Reddit results that rank in the top 10. We analyzed how often each appears — and where they overlap — across different query types.
Statistical summary
| Dimension | Odds Ratio | Interpretation |
|---|---|---|
| Rep vs. Growth | 0.62 | Reddit is 38% less likely to appear for Rep |
| Branded vs. Non | 1.64 | Reddit is 64% more likely to appear for branded |
| Intent | 1.58 | Reddit is 58% more likely to appear for transactional |
- Odds Ratio = likelihood of Reddit appearing in the first group vs. the second.
- All differences are statistically significant (FDR-adjusted p < 10⁻³⁰).
Takeaways
- Reddit-only exposure (without the panel) remains common — 15–30% of queries across most segments.
- Double exposure (Reddit + panel) peaks on Rep , branded , informational queries (22.6%).
- Transactional queries lean toward the panel: every slice shows Forums-only ≥ Reddit-only.
- A large silent zone exists: over 35% of queries show neither Reddit nor the panel — rising to 70% for Rep , non-branded , informational.
- A notable March dip shows volatility: Forums-only dropped sharply mid-month, while Reddit-only slightly increased.
2.4: Target-domain presence in the Top 10
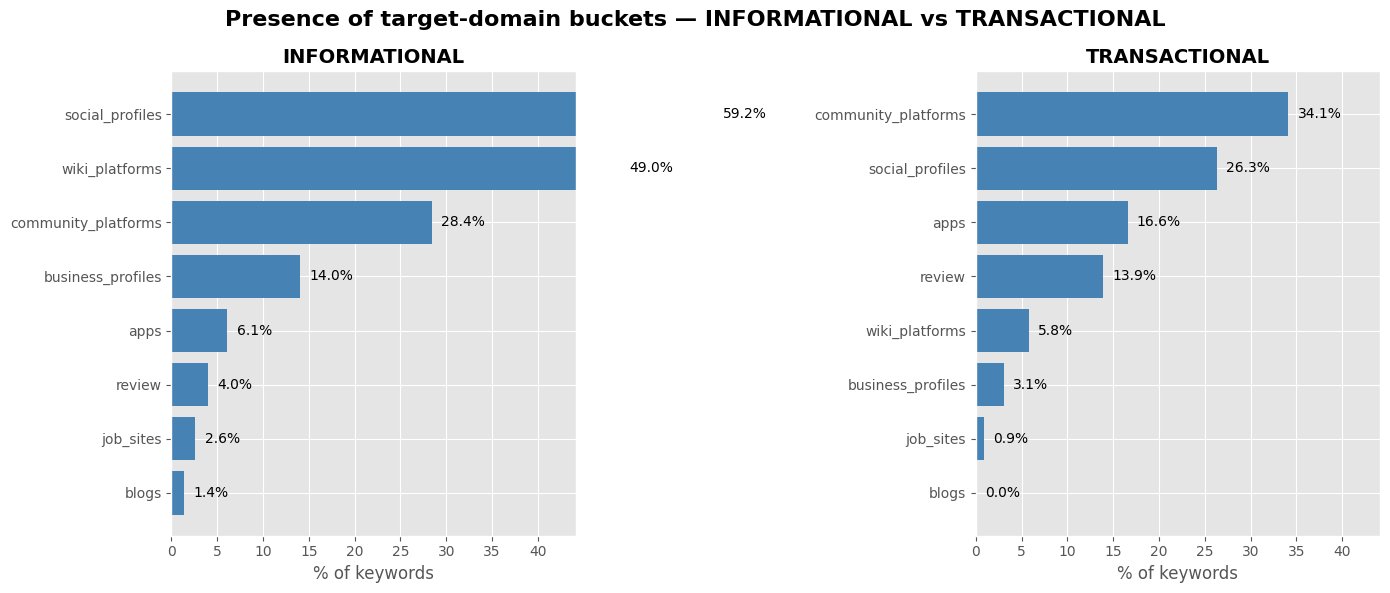
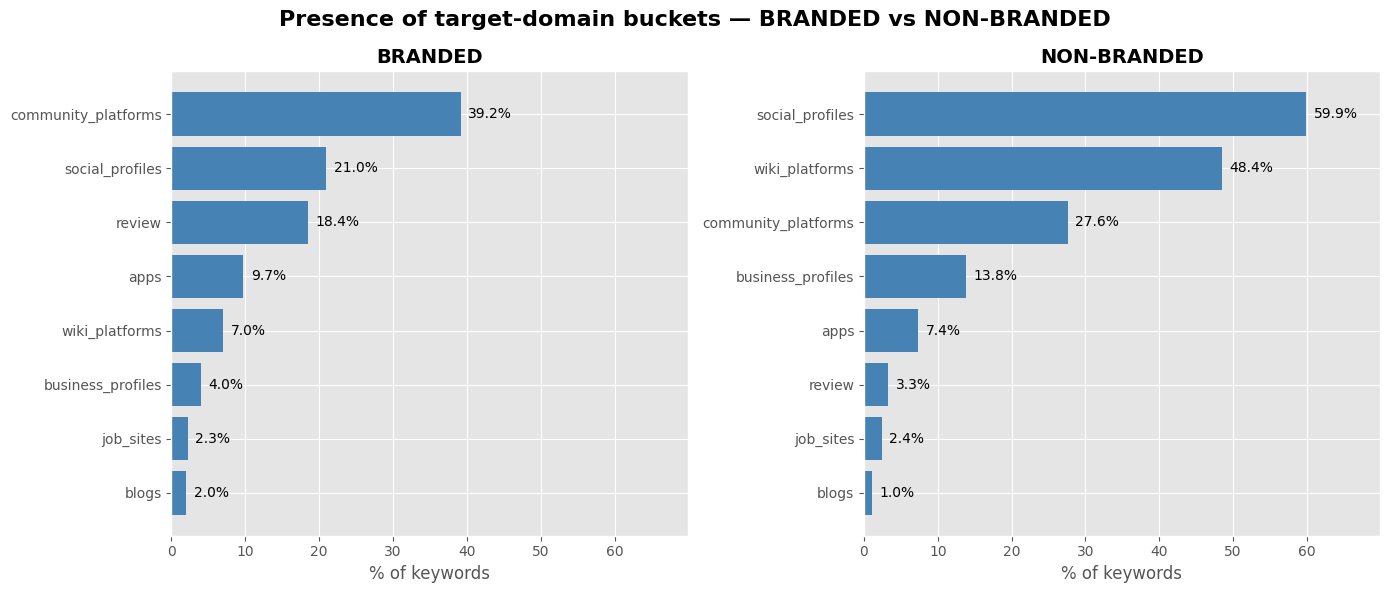
We examined how target-domain visibility varies by keyword type, brandedness, and intent. The charts below illustrate these patterns.
Statistical Inference
| Domain Type | Rep vs. Growth | Informational vs. Transactional | Branded vs. Non-Branded |
|---|---|---|---|
| Social Profiles | Rep (4.6×) | Informational (4.6×) | Non-Branded (5.9×) |
| Business Profiles | Rep (6.2×) | Informational (7.3×) | Non-Branded (3.7×) |
| Wiki Platforms | Rep (3.6×) | Informational (20.7×) | Non-Branded (20.0×) |
| Apps & App Stores | Rep (3.7×) | Transactional (3.2×) | Branded (1.3×) |
| Review Sites | Rep (6.1×) | Transactional (3.7×) | Branded (6.4×) |
| Job Sites | Rep (2.6×) | Informational (4.0×) | — |
| Blogs | Rep (2.5×) | Informational (62.0×) | Branded (1.8×) |
| Community Platforms | Growth (1.6×) | Transactional (1.4×) | Branded (1.5×) |
Note:
Odds Ratio: A value above 1 means the domain type is more likely to appear for the first category (e.g., Rep, Informational, Branded);
a value below 1 means it’s more likely for the second category (e.g., Growth, Transactional, Non-Branded).
2.5: Most-frequent individual domains in Top 10
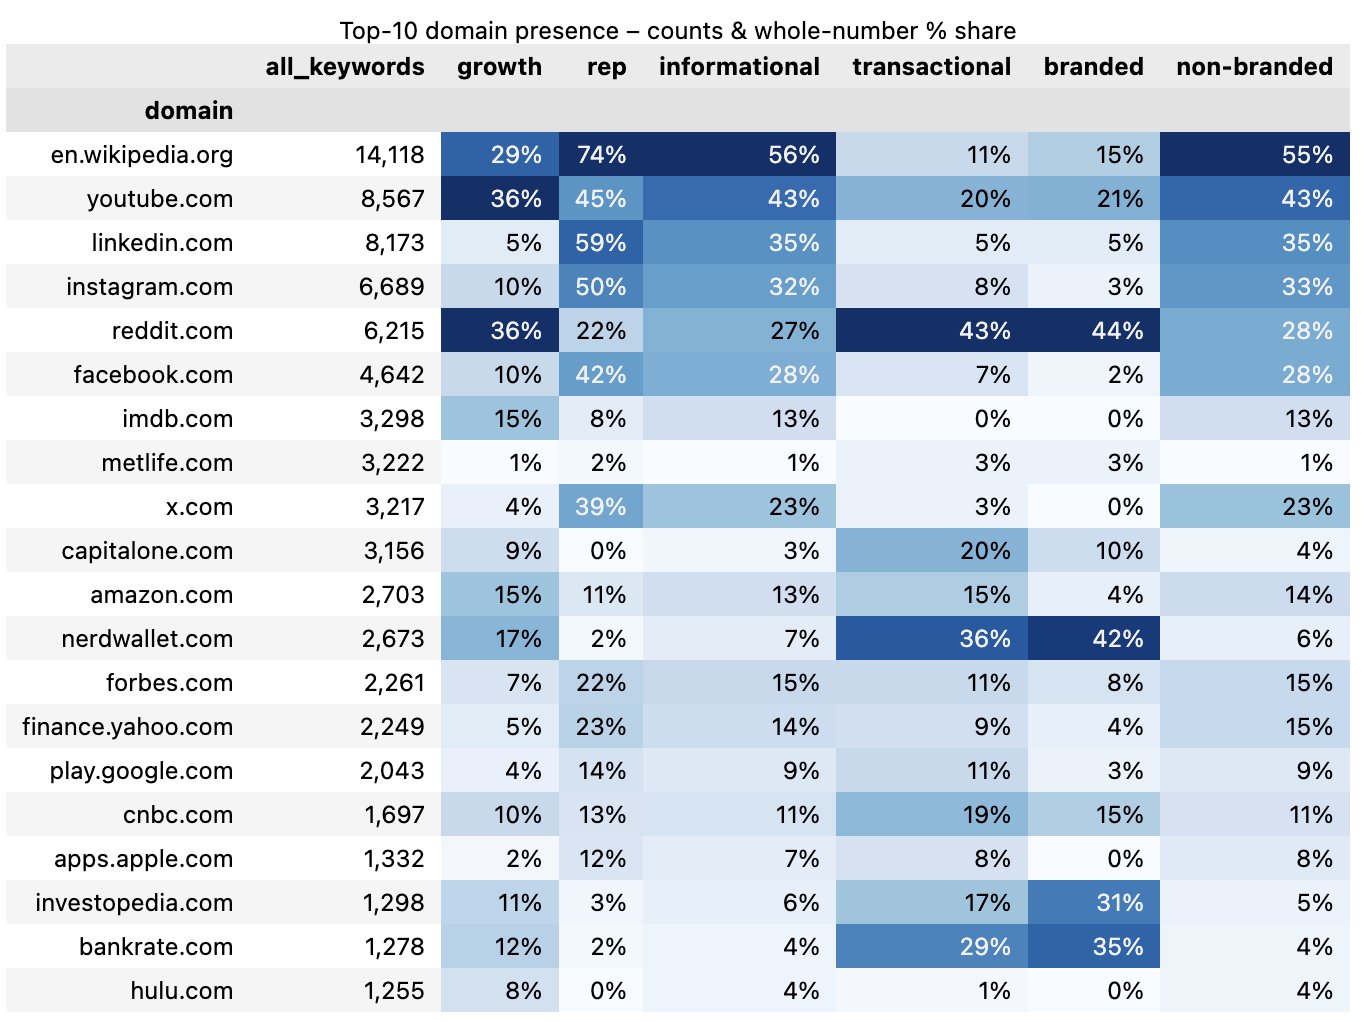
Which domains dominate Google’s top 10 results — and how does that vary across query types?
Takeaways
- Wikipedia appears in ~75% of Rep and branded queries — far more than Growth or non-branded queries. It also dominates informational searches (56%).
- LinkedIn and Instagram drive up Rep and informational results — showcasing social presence and authority.
- Reddit is prominent across the board but shows an edge for transactional and branded keywords.
- Nerdwallet and CapitalOne favor Growth and transactional queries — reflecting user interest in financial advice and services.
- YouTube gains traction in informational SERPs, supporting visual learning behavior.
Conclusion and Next Steps
SERP volatility isn’t just noise. It’s a signal that Google is intentionally shaping results based on query type and user intent. For brands, visibility now depends not only on ranking but also on matching the right content format to what users expect. Whether the query is Reputational, Growth-driven, branded, or transactional, the prominence of features like forums, news panels, or structured answers varies accordingly.
These findings point to a few areas worth exploring further. One is tracking how SERP composition changes over time—especially around major news events or algorithm updates—to uncover patterns in how Google shifts visibility. Another is testing content formats across keyword types to see which ones perform best. For example, do Q&A pages outperform blogs on transactional queries? Do forum-style discussions gain more traction on Growth keywords? These kinds of targeted experiments could help brands better align with what Google is actually surfacing.
Keyword segment definitions
Reputational (Rep) Keywords: Search terms that relate to a company’s public image, leadership, or brand perception. These often include branded terms (e.g., “Amazon”), comparative queries (“REI vs. North Face”), or extended branded topics (“Domino’s Glassdoor”, “Washington Nationals owner”).
Growth Keywords: Broad, audience-expanding terms, often product- or service-related, e.g., “best credit cards 2025”
Informational Intent: Queries seeking knowledge or education, e.g., “how credit card points work”
Transactional Intent: Queries with purchase or signup intent, e.g., “apply for travel credit card”
Branded Keywords: Contain specific brand names, e.g., “American Express Platinum review”
Non-Branded Keywords: Generic terms without brand names, e.g., “top rewards cards”

